5. Reports
The Reports module is available under Service Desk -> Reports. It groups ticket activity into five operational menus: Tickets Log, Incident Reports, Technician Reports, Facility Reports, and SLA Reports.
The reports are designed for operational review, monitoring, accountability, and export. Each screen reads ticketing data for the active organization, applies the selected filters, then presents either a detailed ticket list or a summarized view.
Report Filtering Logic
Most reports use the active organization as the primary boundary. Date-based reports use the selected date range and include records created within that period. Technician, facility, region, and SLA summaries use the same date range so the displayed cards, table rows, and exports remain aligned.
The system also supports paging for table views. Search and advanced filters narrow the ticket list before the final report rows are shown.
5.1 Tickets Log
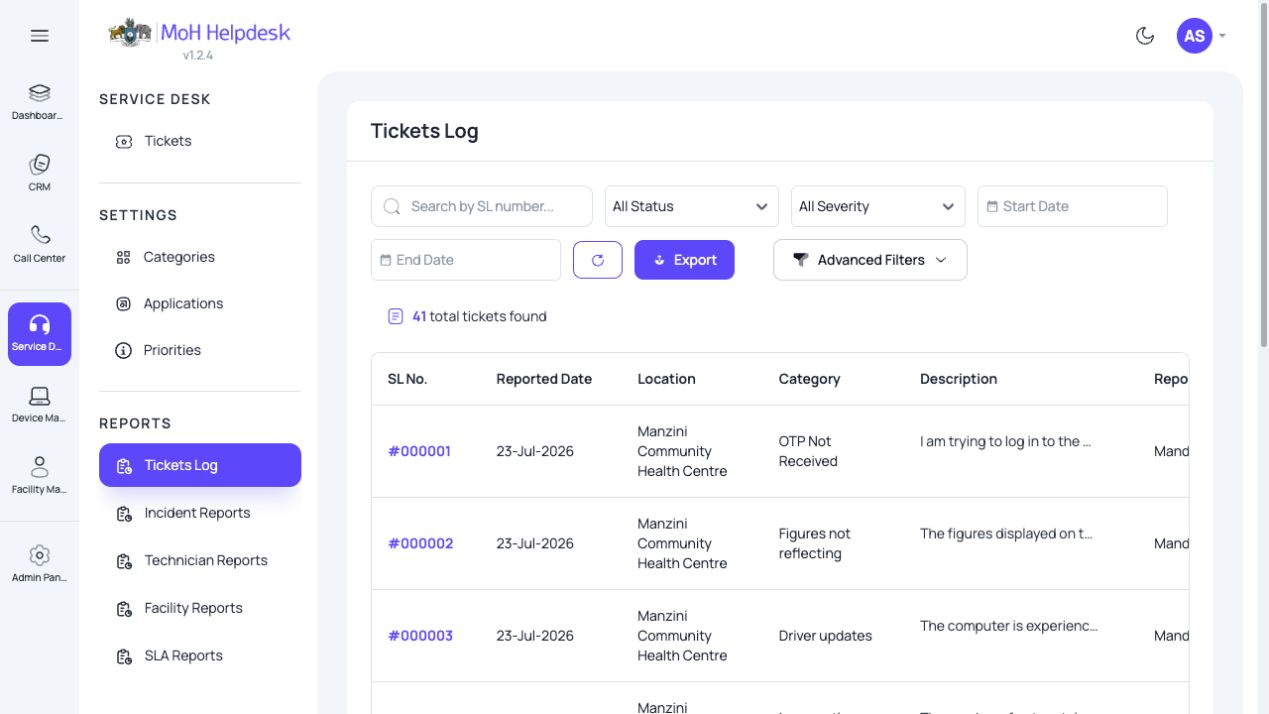
The Tickets Log is the operational ticket register. It is used to review individual tickets and understand who reported them, where they came from, how they were categorized, who handled them, and how they were resolved.
The log includes:
| Field | Logic |
|---|---|
| Ticket number | Comes from the ticket serial number. |
| Reported date | Uses the ticket creation date, converted for display. |
| Location | Resolved from the facility linked to the ticket. |
| Category | Uses the assigned incident category. |
| Description | Shows the ticket description, usually shortened in the table. |
| Reported by | Resolved from the reporting contact. |
| Severity | Uses the ticket priority value. |
| Assigned to | Uses the latest active assignment for the ticket. |
| Resolved date | Uses the most recent resolution message or ticket resolution date where available. |
| Resolved time | Calculated from ticket creation time to resolution time. |
| Status | Uses the current ticket status. |
| Resolution | Uses the latest message marked as a resolution. |
The screen supports searching by ticket number, title, description, and category. It can also filter by date range, status, severity, facility, category, region, and assigned user. When an assigned user filter is applied, the system checks the latest non-deleted assignment for each ticket.
Only non-deleted tickets are included in the log.
5.2 Incident Reports
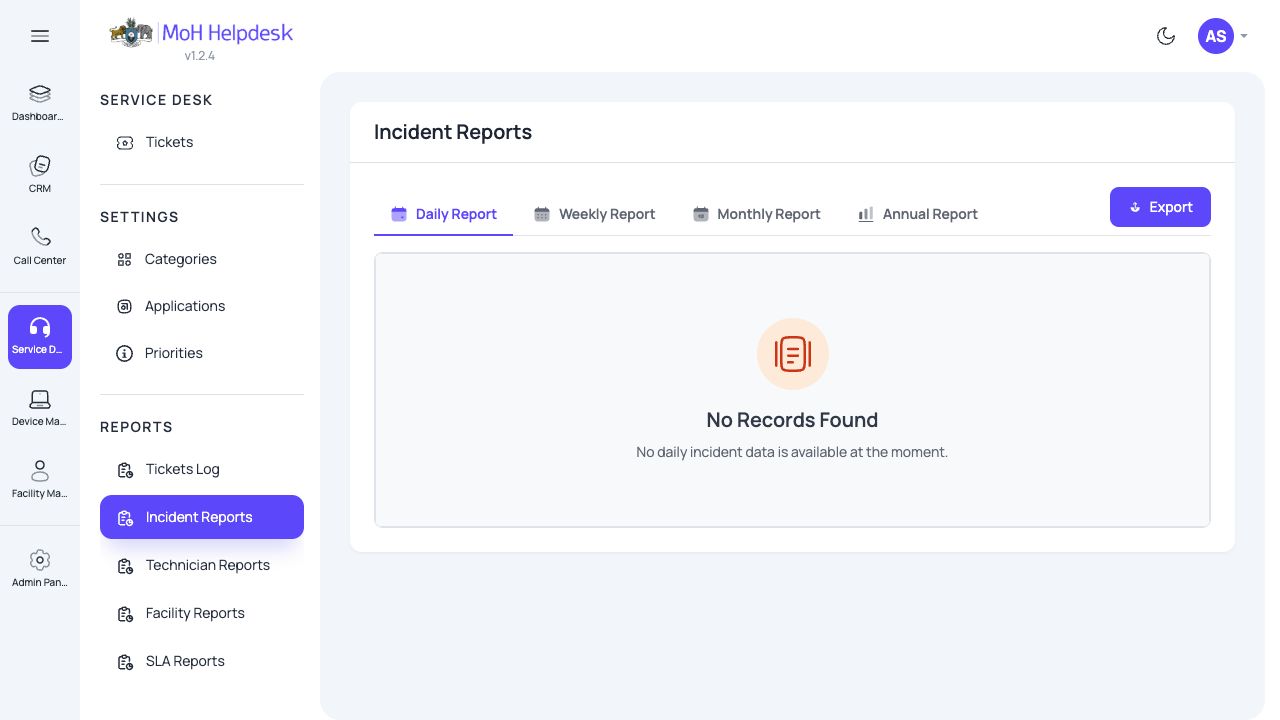
Incident Reports provide time-based views of incident activity. They are split into daily, weekly, monthly, and annual reporting tabs.
| Segment | Logic | Result |
|---|---|---|
| Daily Report | Reads incidents created in the last 24 hours. | Shows each incident with ticket number, title, priority, created date, and current status. |
| Weekly Report | Reads incidents created in the last 7 days. | Shows each incident with ticket number, title, priority, created date, resolved date, and progress/status. |
| Monthly Report | Reads incidents created in the last 30 days and groups them by category. | Shows total incidents, open, in-progress, closed, overdue, category-wise totals, average resolution time, and resolution rate. |
| Annual Report | Reads incidents created in the last year and groups them by month and category. | Shows annual totals, monthly trend, category totals, closed tickets, SLA success rate, breached count, and average resolution time. |
Monthly average resolution time is calculated only from closed incidents that have a resolved date. The monthly resolution rate is calculated as closed tickets divided by total tickets for each category.
Annual SLA performance is calculated from closed tickets. A ticket is counted as within SLA when it was resolved on or before its due date. The annual trend groups ticket creation dates by month.
5.3 Technician Reports
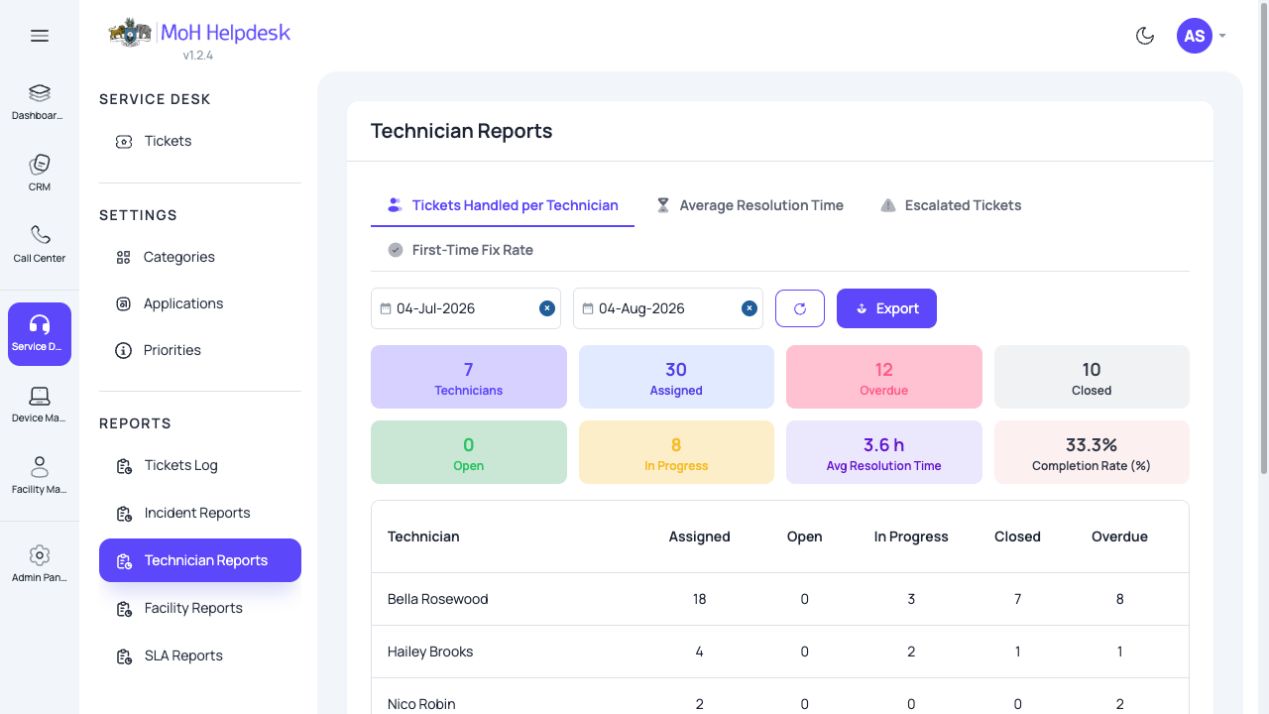
Technician Reports measure workload, resolution speed, escalation activity, and first-time-fix performance for the selected date range.
| Segment | Logic | Result |
|---|---|---|
| Tickets Handled per Technician | Finds each ticket's latest active assignment and groups the tickets by technician. | Shows technician count, assigned tickets, open, in-progress, closed, overdue, average resolution time, and completion rate. |
| Average Resolution Time | Uses closed tickets that have a resolved date and groups them by technician. | Shows closed ticket count, average resolution time, minimum resolution time, and maximum resolution time. |
| Escalated Tickets | Reads assignment history in date order and records assignment changes as escalation events. | Shows escalation count, unique tickets escalated, involved technicians, escalation source, escalation destination, ticket number, priority, and current status. |
| First-Time Fix Rate | Checks closed or resolved tickets against assignment history and resolution messages. | Counts a ticket as first-time fixed when it was not escalated and has exactly one resolution message. |
The completion rate in the workload report is calculated from closed tickets divided by assigned tickets. Average resolution time uses only closed tickets with valid resolution dates.
First-time-fix performance uses a stricter rule than normal closure. A ticket must be resolved without reassignment/escalation and must have one resolution message. Tickets with multiple assignments or multiple resolution attempts are counted as not first-time fixed.
5.4 Facility Reports
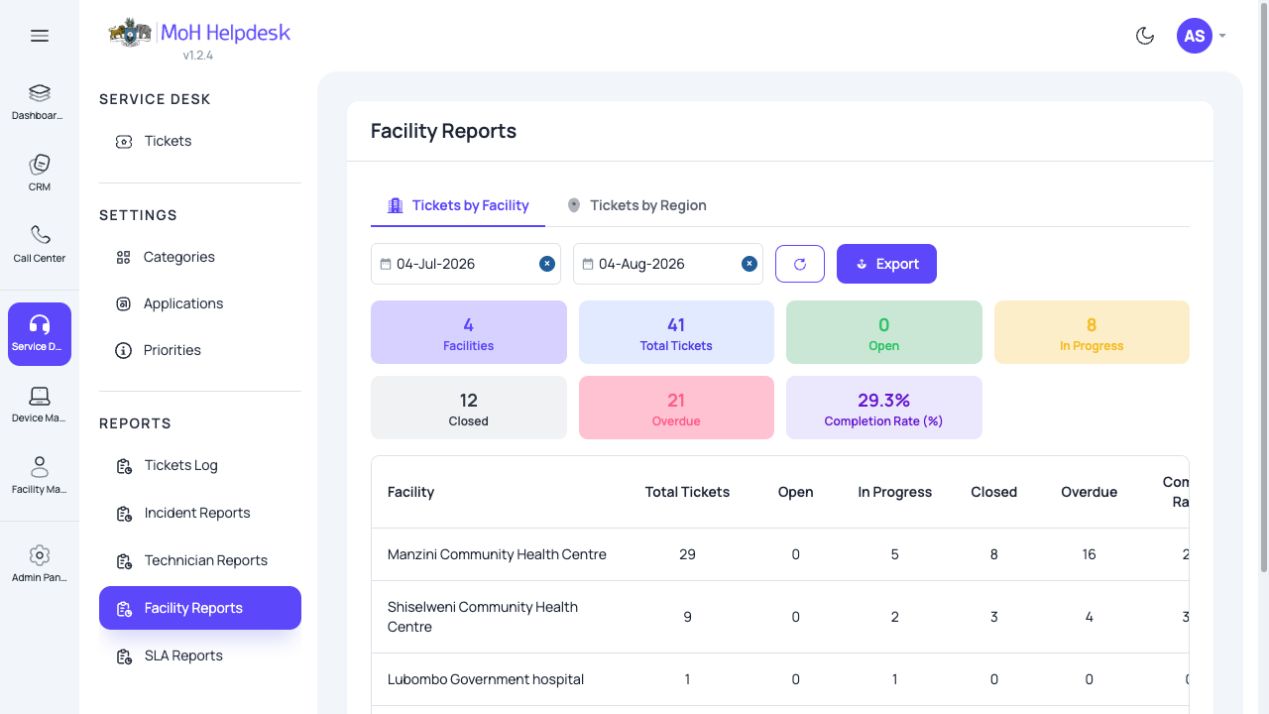
Facility Reports show how ticket volume and completion are distributed across facilities and regions for the selected date range.
| Segment | Logic | Result |
|---|---|---|
| Tickets by Facility | Groups tickets by facility and compares the results against the configured facility list. | Shows number of facilities, total tickets, open, in-progress, closed, overdue, and completion rate. |
| Tickets by Region | Maps each ticket's facility to its configured region, then groups tickets by region. | Shows number of regions, total tickets, open, in-progress, closed, overdue, and completion rate. |
Facility completion rate is calculated as closed tickets divided by total tickets for that facility. Region completion rate uses the same calculation after tickets are grouped by region.
Configured facilities and regions can appear even when they have no tickets in the selected range. If a ticket has a facility that cannot be mapped to a configured region, it is grouped separately as unmapped data.
5.5 SLA Reports
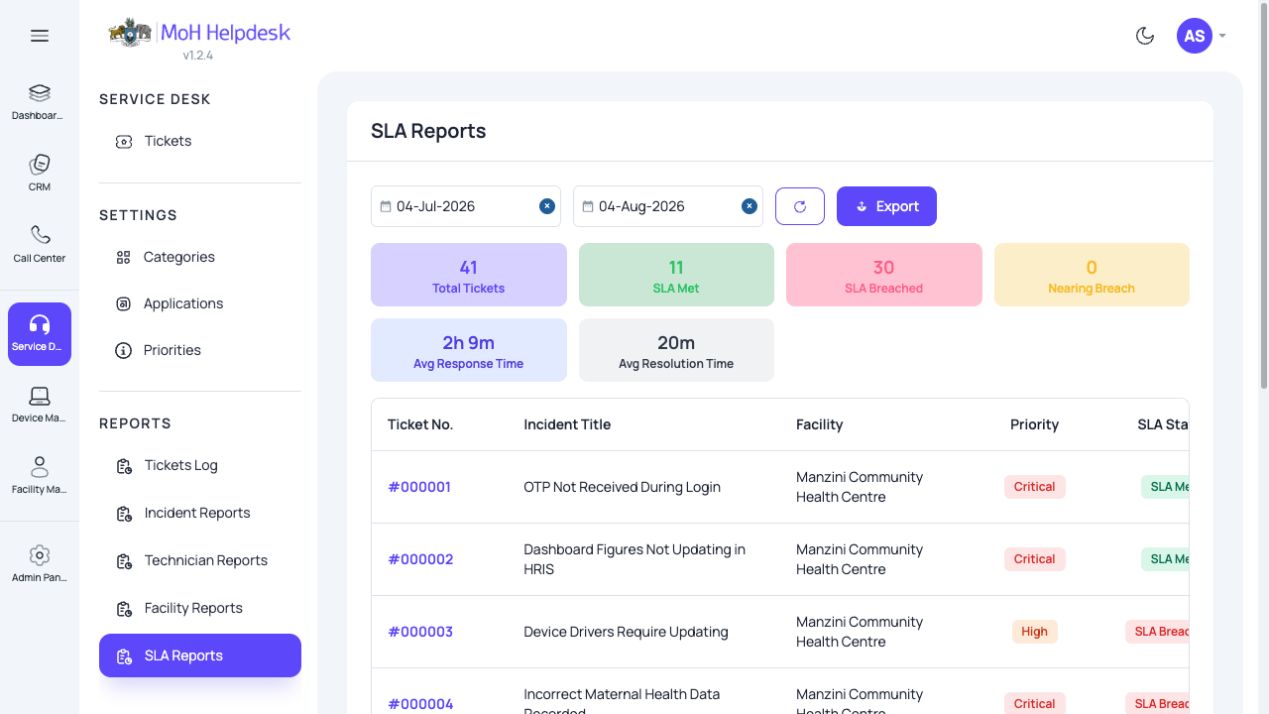
SLA Reports show whether tickets are meeting, nearing, or breaching SLA targets for the selected date range.
The report calculates:
| Metric | Logic |
|---|---|
| Total Tickets | Counts all selected tickets in the date range. |
| SLA Met | Counts tickets that are still within SLA or were resolved on or before the due date. |
| SLA Breached | Counts tickets that passed the due date or were resolved after the due date. |
| Nearing Breach | Counts active tickets that have consumed at least two-thirds of the configured SLA time but have not yet passed the due date. |
| Average Response Time | Calculates the time from ticket creation to the first ticket message. |
| Average Resolution Time | Calculates the time from ticket creation to the latest message marked as a resolution. |
SLA status is decided using ticket priority configuration and due dates. When a priority has configured SLA time, that value is used as the expected limit. If configuration is not available, the ticket's due date and creation date are used to infer the available time.
Closed or resolved tickets are marked as SLA Met when the resolved date is on or before the due date. Active tickets are marked as SLA Breached when the current UTC time is past the due date. Active tickets are marked as Nearing Breach when they have used at least two-thirds of the allowed SLA window.
Export Logic
Each report screen can export its current report data. Exports use the same business logic as the visible report, so the downloaded file should match the selected organization, date range, and filters shown on screen.
Exports are generated by report helper classes after the report data is calculated. This keeps the UI table and downloaded spreadsheet aligned.
Notes for Developers
The report implementation follows the same CQRS structure used across the Ticketing microservice:
- The controller receives the report request.
- A MediatR query is created for the selected report.
- The query handler calls the report repository.
- The repository reads ticketing data, applies filters, performs grouping/calculations, and returns DTOs.
- Export handlers pass the calculated result into spreadsheet helper classes.
When changing a report, update the calculation, displayed DTO, and export helper together so screen values and downloaded files remain consistent.